Hazard, risk and vulnerability: the concepts of disaster management
- Syllabus
- Disaster and disaster management
- As of
- October 2026
- hazard
- exposure
- vulnerability
- capacity
- disaster risk
- resilience
- coping capacity
- disaster management cycle
- build back better
- rapid and slow onset
- High Powered Committee 1999
- multi hazard exposure
- Vulnerability Atlas of India
The first principle
A natural event becomes a disaster only when it meets people who are in its way and cannot cope with it. A cyclone over an empty ocean is a hazard but not a disaster, while a moderate earthquake under a town of heavy stone houses can kill thousands. Since we cannot stop most hazards, the whole of disaster management works on the other factors: who is exposed, how fragile they are and how much capacity they have to absorb the blow.
The core
The four building blocks
- Hazard is a process, phenomenon or human activity that may cause loss of life, injury, damage to property, social and economic disruption or environmental damage. It is described by its magnitude, frequency, location and speed.
- Exposure is the situation of people, houses, infrastructure, crops and other assets located in places where a hazard can strike. Exposure grows when cities spread onto floodplains and hotels climb unstable Himalayan slopes.
- Vulnerability is the set of physical, social, economic and environmental conditions that make people or assets more likely to be harmed. A mud house is physically vulnerable, while a poor household without savings, land titles or insurance is economically vulnerable; women, children, the elderly, persons with disabilities and migrants are often more vulnerable because they have less access to warnings, transport and relief.
- Capacity is the combination of strengths, resources and skills available to a community or an organisation to manage and reduce risk. Cyclone shelters, trained volunteers, early warning systems, building codes that are actually enforced and money in reserve are all forms of capacity, and coping capacity is the part that can be used during and just after an event.
Risk and disaster
- Disaster risk is the potential loss of life, injury and destroyed or damaged assets that could occur in a given period. For teaching, it is written as a ratio: risk equals hazard × exposure × vulnerability, all divided by capacity. It is a way of thinking rather than a formula to calculate: lowering any factor on top, or raising capacity, lowers risk.
- Disaster in Section 2(d) of the Disaster Management Act 2005 means a catastrophe, mishap, calamity or grave occurrence from natural or man made causes, or by accident or negligence, which causes substantial loss of life, suffering, damage to property or degradation of the environment, and which is beyond the coping capacity of the affected community. The last clause matters most, because it ties the legal definition to capacity and not to the size of the event.
- Resilience is the ability of a system or community exposed to a hazard to resist, absorb, adapt to and recover from it in time, while keeping its essential functions. The Intergovernmental Panel on Climate Change (IPCC) defines climate risk with the same hazard, exposure and vulnerability logic.
The disaster management cycle
- Before a disaster, prevention avoids new risk (not building on a floodplain), mitigation lessens the impact of risk that cannot be avoided (retrofitting schools, raising embankments) and preparedness gets people ready to act (plans, warnings, drills, stocks). Together they are called risk management.
- During and just after, response saves lives and meets basic needs through evacuation, search and rescue, medical care, food, water and shelter. This is crisis management.
- After a disaster, recovery restores and improves life through rehabilitation (homes, jobs, services) and reconstruction (rebuilding infrastructure). The principle of build back better asks that rebuilding should reduce risk, so a destroyed school is rebuilt to a seismic code and not as it was.
- Levels of disaster. The National Disaster Management Plan grades events from L0 (normal times, for preparedness) through L1 (managed by the district) and L2 (needs the State) to L3 (needs the Centre), which links the cycle to the tier that must lead.
Dimensions
- By origin. Natural disasters arise from geophysical processes (earthquake, tsunami, volcano), hydrological and meteorological ones (flood, cyclone, cloudburst), climatological ones (drought, heat wave) and biological ones (epidemics, pest attacks). Human made disasters come from technology, industry, accidents and conflict, such as the gas leak at Bhopal in 1984 or a building collapse.
- By speed. Rapid onset disasters such as earthquakes and flash floods give minutes or hours of warning, while slow onset disasters such as drought and sea level rise build over months or years. The first needs warnings and evacuation; the second needs monitoring, livelihood support and adaptation.
- The High Powered Committee grouping. The High Powered Committee on Disaster Management, set up in 1999 under J C Pant, listed 31 disasters in five groups: water and climate related, geologically related, chemical, industrial and nuclear, accident related, and biologically related. It was India's first attempt to treat all hazards together.
- Social. Disasters fall hardest on the poor, who live in the most exposed places in the weakest houses, so a disaster widens inequality unless relief is targeted.
- Economic and environmental. Losses include damage to assets and indirect losses from lost harvests and workdays, while healthy ecosystems are themselves capacity: mangroves cut storm surge, wetlands absorb floodwater and forests hold slopes.
- Climate. Warming is changing the hazard itself, with more intense rain and hotter heat waves; the details are in the note on climate change impacts on India.
In practice
India's multi hazard exposure
- The National Disaster Management Authority (NDMA) profile. About 58.6 per cent of India's landmass is prone to earthquakes of moderate to very high intensity; over 40 million hectares, about 12 per cent of the land, is prone to floods and river erosion; close to 5,700 km of the 7,516.6 km coastline is prone to cyclones and tsunamis; and 68 per cent of the cultivable area is vulnerable to drought. The Geological Survey of India estimates that about 12.6 per cent of the land area outside snow cover is prone to landslides.
- The Vulnerability Atlas of India. The Building Materials and Technology Promotion Council (BMTPC) of the Ministry of Housing and Urban Affairs published its third edition in 2019. It maps earthquake, wind, flood, landslide and thunderstorm hazard district by district and, using Census 2011 data on wall and roof materials, shows how many houses of each type face each level of damage risk. The seismic zone map is in the note on earthquakes and tsunamis.
Three cases, three factors
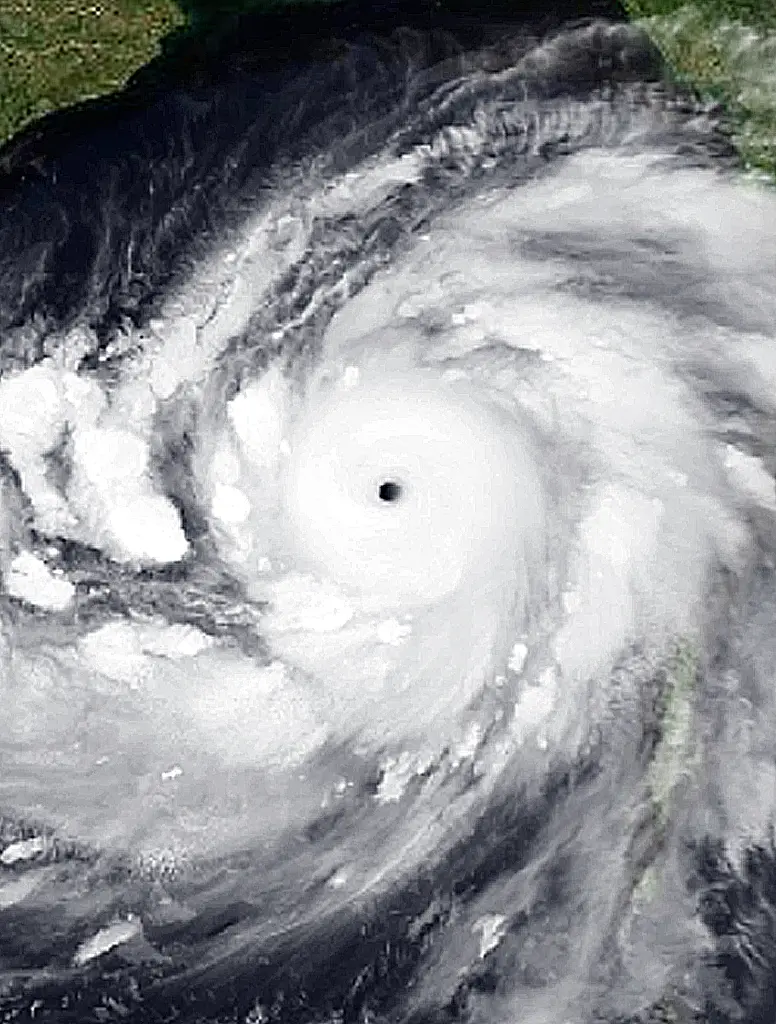
- Capacity: Odisha, 1999 and 2013. The super cyclone that struck Odisha in October 1999 killed nearly 10,000 people. Odisha then set up India's first State disaster management authority in 1999, built hundreds of cyclone shelters and trained village volunteers, so when Cyclone Phailin, a very severe cyclonic storm and the strongest to strike that coast since 1999, crossed near Gopalpur in October 2013, close to a million people were moved to safety and deaths stayed in the dozens. The hazard was of the same order; capacity had changed.
- Vulnerability: Latur, 1993. The earthquake of September 1993 in Latur and Osmanabad districts of Maharashtra was of only moderate magnitude, yet close to 8,000 people died because it struck at night and heavy stone walls and roofs collapsed on sleeping families. The lesson was that houses kill, not quakes, and the reconstruction that followed used lighter, earthquake resistant designs.
- Exposure: Chennai, 2015. The floods of December 2015 followed very heavy rain, but much of the damage came where the city had grown over its lakes, marshes and river floodplains, including the Pallikaranai marsh.

Issues and way forward
- Relief centred thinking. Money and attention still go mainly to response, because relief is visible and mitigation is not; the shift to risk reduction that the Sendai Framework asks for means spending on prevention before the event, as the Finance Commission mitigation funds now require.
- Hidden vulnerability. Risk maps show hazards well but vulnerability poorly, because data on house types, incomes and disability are old or missing; updating the Vulnerability Atlas with new Census data and building a district risk register under the disaster database created in 2025 would close the gap.
- Exposure keeps growing. Rapid urbanisation places more people and assets in hazard zones every year, and plans often ignore floodplains and fault lines; risk sensitive land use planning and enforcement of building codes are the remedies that every NDMA guideline repeats.
- Cascading events. A cloudburst triggers landslides that dam rivers and then burst as floods, so single hazard planning misses the chain; multi hazard assessment is the answer.
- Capacity at the last mile. Warnings reach districts but not always households, and the poorest lack the means to act on them; community based disaster management, local volunteers and inclusive warnings for women, the elderly and persons with disabilities build capacity where it counts.
Common confusions
- Hazard and disaster. A hazard is the potential event, while a disaster is what happens when it meets exposed, vulnerable people who cannot cope; a cyclone that crosses an empty coast is a hazard event but not a disaster.
- Vulnerability and exposure. Exposure is about being in the path, while vulnerability is about how badly one is hurt there; two houses on the same coast have the same exposure but a concrete house is less vulnerable than a thatched one.
- Mitigation and preparedness. Mitigation reduces the impact itself (a stronger building, a mangrove belt), while preparedness readies people to respond (a warning, a drill, a stock of food); both come before the event.
- The coastline figure. NDMA uses 7,516.6 km, the older length; a remeasurement on finer maps, adopted in 2025, put India's coastline at 11,098.81 km, so quote the base along with any share.
For the exam
- Keyword bank: hazard, exposure, vulnerability, capacity, disaster risk, coping capacity, resilience, disaster management cycle, prevention and mitigation, preparedness, build back better, rapid and slow onset, multi hazard exposure, Vulnerability Atlas of India, cascading hazards.
- Previous year questions: Practise the previous year questions on this topic →
- Use in an answer:
- Introduction with data: About 58.6 per cent of India's landmass is prone to earthquakes, 12 per cent to floods, close to 5,700 km of its coastline to cyclones and tsunamis and 68 per cent of its cultivable area to drought (NDMA), which makes India one of the most multi hazard prone countries in the world.
- Introduction with a law: The Disaster Management Act 2005 defines a disaster as an event beyond the coping capacity of the affected community, which places capacity, and not the size of the hazard, at the centre of disaster management.
- Conclusion: Odisha's journey from the super cyclone of 1999 to Phailin in 2013 shows that hazards cannot be stopped but deaths can, when exposure is managed, vulnerability reduced and capacity built before the event.
- Conclusion: India must move from relief to risk reduction, so that every rupee spent on rebuilding also builds back better.