Logistics and urban infrastructure
- Syllabus
- Infrastructure: energy, ports, roads, airports, railways etc.
- As of
- October 2026
- logistics cost
- National Logistics Policy 2022
- PM Gati Shakti National Master Plan
- multimodal logistics park
- first and last mile
- Unified Logistics Interface Platform
- LEADS index
- warehousing receipts
- Smart Cities Mission
- AMRUT 2.0
- Metro Rail Policy 2017
- transit oriented development
- value capture finance
- municipal finance
The first principle
Goods and people create value only when they reach the place where they are needed, so the cost of moving them is a tax on every transaction in the economy. A firm pays that tax in freight, waiting time, handling, storage and the inventory it must hold because delivery is uncertain, and it passes the tax on in its prices. Logistics policy is therefore about joining modes and cutting delay, not only about building more roads, and cities matter because that is where most of the movement, and most of the waiting, takes place.
The core
What logistics cost is, and how it is measured
- Logistics cost is what an economy spends in a year on transport, warehousing, handling, inventory carrying and the administration of moving goods. It is expressed as a share of gross domestic product (GDP), but the ratio also depends on what an economy produces: a services heavy economy moves fewer tonnes per rupee of output, so its ratio looks low even if its freight is slow.
- The old figure was never an official one. For a decade it was quoted as 13 to 14 per cent of GDP, a number built from partial and foreign estimates. The National Council of Applied Economic Research (NCAER) put it at 7.8 to 8.9 per cent of GDP for 2021-22 in a study of December 2023.
- The first official estimate came in September 2025, when the Department for Promotion of Industry and Internal Trade (DPIIT) released the NCAER study Assessment of Logistics Cost in India. Using surveys of firms and official data, it put the cost for 2023-24 at Rs 24.01 lakh crore, which is 7.97 per cent of GDP and 9.09 per cent of the output of the non services sectors. The caveat is that the method is new, so the figure cannot be set against the older ones to claim a fall; it also found that small firms pay much more per unit than large ones.
The two policies that frame the sector
- PM Gati Shakti National Master Plan, launched on 13 October 2021, is a geographic information system platform built by the Bhaskaracharya National Institute for Space Applications and Geo-informatics (BISAG-N). Every infrastructure ministry and State puts its existing and planned assets on one map, so a road, a pipeline and a rail line are planned together instead of digging the same land three times. The Budget of 2022-23 named its seven engines: railways, roads, ports, waterways, airports, mass transport and logistics infrastructure.
- Its institutions are an Empowered Group of Secretaries chaired by the Cabinet Secretary, a Network Planning Group of the ministries' planning heads that examines large projects before approval, and a Technical Support Unit, with DPIIT's Logistics Division as secretariat.
- The National Logistics Policy (NLP), released on 17 September 2022, is the software that sits on Gati Shakti's hardware. It set three targets for 2030: bring logistics cost down to global benchmarks, place India among the top 25 countries in the World Bank's Logistics Performance Index (LPI), and build a data driven system for decisions. Its digital core is the Unified Logistics Interface Platform (ULIP), which links the data systems of different ministries so that a shipper can track a container, a truck or a wagon through one interface.
Dimensions
- Economic. Slow and uncertain freight makes Indian goods less competitive and forces firms to hold more stock, which ties up working capital; a predictable trip is often worth more than a cheaper rate.
- Modal. Rail and water move bulk freight more cheaply per tonne kilometre and with less fuel, yet road carries most freight because it goes door to door; the worked example shows how the first and last mile and handling eat rail's advantage.
- Federal. Ports, highways and railways are largely Central, while land, urban transport, warehousing licences and road checks are largely with States and cities. The Logistics Ease Across Different States (LEADS) index, published since 2018, ranks States on infrastructure, services and regulation so that they compete.
- Fiscal and institutional. The Goods and Services Tax (GST) of 2017 removed State border checkposts and, with the electronic way bill of 2018, cut the hours trucks spent waiting, so a tax reform was also a logistics reform. Logistics was added to the harmonised list of infrastructure sub sectors in November 2017, which lets it borrow on infrastructure terms.
In practice
Logistics
- Rankings. India ranked 38th of 139 countries in the World Bank's LPI of 2023, up from 44th in 2018, and the NLP's target is the top 25.
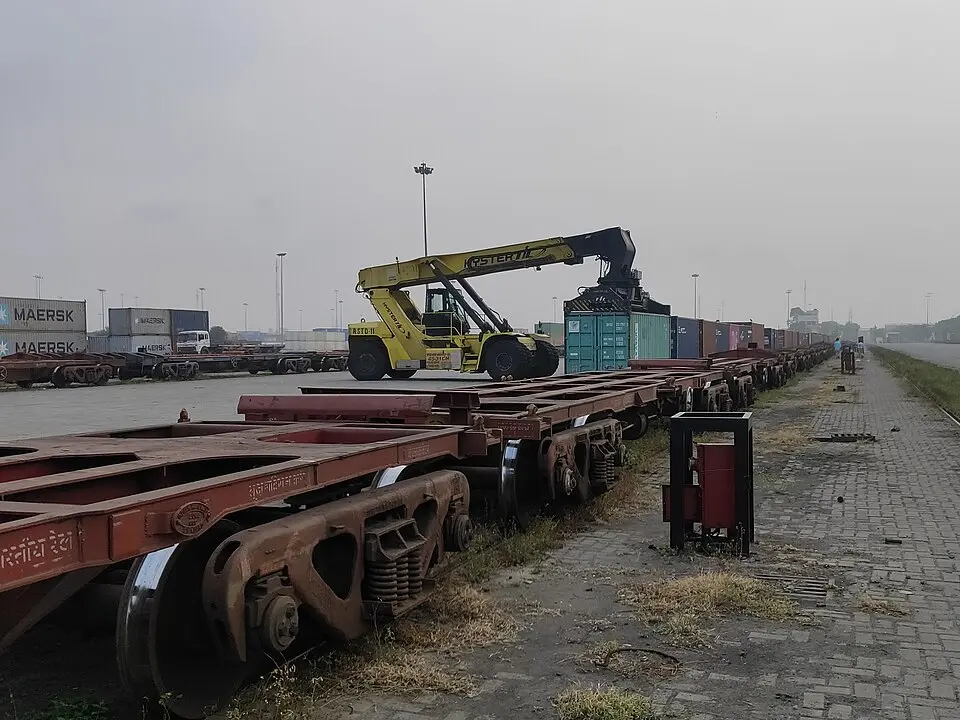
- Physical links. Bharatmala plans 35 multimodal logistics parks, where rail, road and sometimes waterways meet with warehouses and customs in one place.
- Warehousing. The Warehousing (Development and Regulation) Act 2007 set up the Warehousing Development and Regulatory Authority (WDRA) in 2010, which registers warehouses and issues electronic negotiable warehouse receipts, so a farmer or trader can borrow against stored goods. Grain storage belongs to the agricultural marketing note.
- Gati Shakti at work. The platform has been extended from Central ministries to the States, and the Union Budget 2025-26 promised that its data and maps would be opened to private firms for planning.

Cities
- Smart Cities Mission. Launched on 25 June 2015, it chose 100 cities through a competition held in rounds from 2016 to 2018. Each city formed a special purpose vehicle (SPV), a company owned equally by the State and the city, for area based development and pan city digital solutions, with Central support of Rs 48,000 crore. The mission period ended on 31 March 2025; as on 4 March 2025, 7,504 of 8,063 projects worth Rs 1,50,306 crore of Rs 1,64,545 crore had been completed (Lok Sabha, April 2025). Each city now runs an Integrated Command and Control Centre for traffic and services.
- AMRUT. The Atal Mission for Rejuvenation and Urban Transformation began in 2015 for water supply, sewerage and parks in 500 cities. AMRUT 2.0, approved in October 2021 for 2021-22 to 2025-26 with a total outlay of Rs 2,99,000 crore and a Central share of Rs 76,760 crore, aims at tap water in every statutory town and sewerage in the 500 AMRUT cities.
- Urban transport. The operational metro network grew from 248 km in 5 cities in 2014 to about 1,095 km in 26 cities, including 55 km of the Delhi–Meerut Regional Rapid Transit System (Press Information Bureau, March 2026). The Metro Rail Policy 2017 makes Central support depend on an alternatives analysis, a plan for feeder services and transit oriented development, and a private role in some part of the project. PM e-Bus Sewa, approved in August 2023 at Rs 57,613 crore with a Central share of Rs 20,000 crore, funds 10,000 electric buses run on a gross cost contract, in which the operator is paid per kilometre and the city keeps the fare risk.
Issues and way forward
- Too much freight on road. Road wins on door to door service while rail terminals are few and handling is slow; more freight terminals, multimodal parks at corridor junctions and tariffs that price the whole trip would shift bulk to rail and water.
- The first and last mile. DPIIT's study found that on a trip of about 600 km, improving the first and last 50 km lowers total cost substantially, so city truck terminals, better access roads to ports and freight entry slots in cities matter as much as the trunk highway.
- Cities without money. Municipal revenues are below 1 per cent of GDP (Reserve Bank, Report on Municipal Finances), while the World Bank estimated in 2022 that Indian cities need about 840 billion dollars of capital investment over 15 years. Better property tax collection, value capture finance (taxing the rise in land value near a new metro line), municipal bonds such as Pune's issue of 2017, and real devolution under the 74th Amendment are the answers.
- Missions that bypass councils. Smart city SPVs were run by officials, so elected councils had little say, and area based development helped only a small part of each city.
- Metros without riders. Several metros carry fewer passengers than projected because feeder buses, walking access and land use around stations lag; transit oriented development and a Unified Metropolitan Transport Authority in each large city, both urged by the 2017 policy, are the answer.
Common confusions
- PM Gati Shakti and the National Logistics Policy. Gati Shakti plans the physical network of roads, rail and pipes on one map, while the NLP works on how goods move over that network, through digital systems, rules, skills and services.
- Logistics cost and freight rate. The freight rate is the price of one trip, while logistics cost also includes storage, handling, inventory and delay, which is why a cheaper rate can still mean a higher total cost.
- Smart Cities Mission and AMRUT. The Smart Cities Mission funded showcase areas and digital systems in 100 chosen cities through SPVs, while AMRUT funds basic water and sewerage across hundreds of towns through the urban local bodies.
- Gross cost and net cost contracts. In a gross cost contract the bus operator is paid per kilometre and the city keeps the fares and the fare risk, while in a net cost contract the operator keeps the fares and bears that risk.
For the exam
- Keyword bank: logistics cost as share of GDP, modal shift, first and last mile, multimodal logistics park, PM Gati Shakti, Network Planning Group, National Logistics Policy, Unified Logistics Interface Platform, LEADS index, electronic negotiable warehouse receipt, special purpose vehicle, transit oriented development, value capture finance, gross cost contract.
- Previous year questions: Practise the previous year questions on this topic →
- Use in an answer:
- Introduction with data: The first official estimate puts India's logistics cost at 7.97 per cent of GDP in 2023-24, far below the 13 to 14 per cent quoted for years, though small firms still pay much more per unit (DPIIT and NCAER, 2025).
- Introduction with a policy: The National Logistics Policy of 2022 aims to bring logistics cost down to global benchmarks and to place India among the top 25 countries in the Logistics Performance Index by 2030.
- Conclusion: Gati Shakti joins the network on one map and the National Logistics Policy joins the services on one platform; the remaining gains lie in the first and last mile, where much of the delay sits.
- Conclusion: Cities will carry most of India's growth, so their infrastructure needs steady municipal revenue, elected councils in charge and transit planned with land use, not only one time missions.