Air pollution
- Syllabus
- Environmental pollution and degradation
- As of
- October 2026
- PM2.5 and PM10
- secondary pollutants
- temperature inversion
- mixing height
- National Ambient Air Quality Standards
- Air Quality Index
- National Clean Air Programme
- non attainment cities
- Graded Response Action Plan
- Commission for Air Quality Management
- stubble burning
- Bharat Stage VI
- household air pollution
- Pradhan Mantri Ujjwala Yojana
- airshed approach
The first principle
The concentration of a pollutant in the air depends on two things: how much is emitted, and how much air it is mixed into. The second depends on the weather, on how high the air near the ground can rise and mix and how fast the wind carries it away, and no government controls the weather. So the same emissions that are harmless on a windy summer afternoon become a health emergency on a still winter night. The only lasting cure for bad air is to cut emissions at their source; everything else, from emergency curbs to smog towers, works on the margin.
The core
Pollutants and sources
- Particulate matter is the pollutant that matters most. PM10 means particles with an aerodynamic diameter up to 10 micrometres, which lodge in the nose, throat and upper airways; PM2.5, up to 2.5 micrometres, reaches the alveoli of the lungs and its finest fraction enters the blood. Particles come from vehicle exhaust, burning of biomass, crop residue and waste, road and construction dust, industry and power plants, and natural dust.
- Primary and secondary pollutants. A primary pollutant is emitted directly, such as soot or sulphur dioxide. A secondary pollutant forms in the air: sulphur dioxide and nitrogen oxides react with ammonia from fertiliser and livestock to form ammonium sulphate and nitrate particles, which make up a large part of winter PM2.5 in north India.
- Gases. Sulphur dioxide comes mainly from burning coal and high sulphur fuel; nitrogen oxides from vehicles and power plants; carbon monoxide from incomplete combustion. Ground level ozone is not emitted at all but formed when nitrogen oxides and volatile organic compounds react in sunlight, which is why it peaks on hot afternoons rather than in winter smog.
Why winter is worse
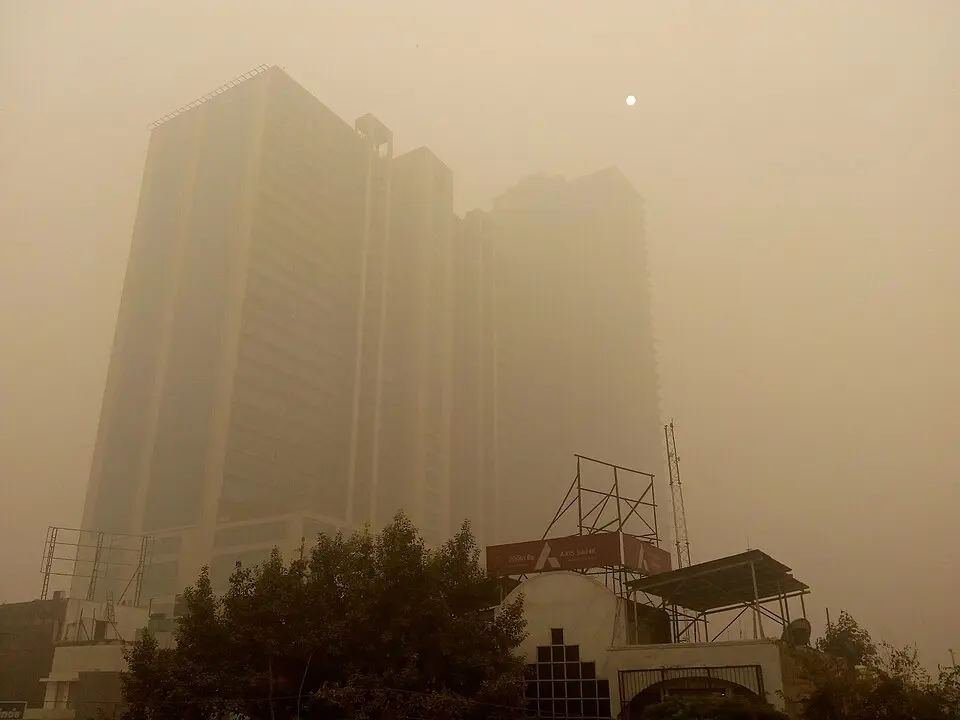
- Temperature inversion. Normally air cools with height, so warm air near the ground rises and carries pollutants up. On clear winter nights the ground loses heat quickly, a layer of cold air settles beneath warmer air, and this inversion acts as a lid. The mixing height, the depth of air in which pollutants spread, can fall to a few hundred metres, and calm winds stop horizontal dispersal.
- The Indo Gangetic Plain is a broad basin bounded by the Himalaya to the north, so in winter the plain's emissions from vehicles, industry, household fuel and post harvest crop burning collect over it, which is why the worst air in India is found from Punjab to Bihar.
Standards and the index
- The National Ambient Air Quality Standards (NAAQS), notified by the Central Pollution Control Board (CPCB) in November 2009, set limits for 12 pollutants. For PM2.5 the annual limit is 40 and the 24 hour limit is 60 micrograms per cubic metre; for PM10 they are 60 and 100. The World Health Organization's (WHO) 2021 guidelines are far stricter, 5 and 15 for PM2.5.
- The National Air Quality Index (AQI), launched in April 2015, converts the readings of eight pollutants, PM10, PM2.5, nitrogen dioxide, sulphur dioxide, carbon monoxide, ozone, ammonia and lead, into one number from 0 to 500 in six bands. Each pollutant gets a sub index and the highest sub index is the day's AQI, provided at least three pollutants are measured and one is particulate matter.
Dimensions
- Health. PM2.5 inflames the airways and blood vessels, causing chronic obstructive pulmonary disease, heart attacks, stroke, lung cancer and low birth weight. A study of the India State-Level Disease Burden Initiative in Lancet Planetary Health (2020) attributed 1.67 million deaths in India in 2019, about 18 per cent of all deaths, to air pollution.
- Economic. The same study estimated the loss from premature deaths and illness at about 1.4 per cent of gross domestic product (GDP) in 2019.
- Equity. Outdoor workers, children, the elderly and women cooking over solid fuel bear the heaviest exposure, and they are least able to buy purifiers or move away.
- Agriculture and climate. Ground level ozone damages crops such as wheat and rice, and black carbon both warms the atmosphere and darkens Himalayan snow, so cutting soot brings climate and health gains together.
- Federal. Air does not stop at State borders, so Delhi's winter air depends on decisions in Punjab, Haryana, Uttar Pradesh and Rajasthan, which is why an airshed body was needed.
- Legal. The Supreme Court treats clean air as part of the right to life under Article 21, and its orders in the M.C. Mehta cases moved Delhi's buses to compressed natural gas (CNG) and fixed the date after which Bharat Stage IV vehicles could not be sold.

In practice
- The law. The Air (Prevention and Control of Pollution) Act, 1981, passed under Article 253 to implement the Stockholm decisions, lets States declare air pollution control areas and requires consent for industry. The Jan Vishwas (Amendment of Provisions) Act, 2023 replaced imprisonment for most violations of the Air Act and the Environment (Protection) Act with monetary penalties.
- The National Clean Air Programme (NCAP), launched by the Ministry of Environment, Forest and Climate Change in January 2019, covers 130 cities that failed the standards or have over a million people. Its first goal was a 20 to 30 per cent cut in particulate concentration by 2024 from 2017 levels; it was revised to a cut of up to 40 per cent in PM10, or meeting the national standard, by 2025-26. Each city has an action plan, and money flows through performance linked grants, including those of the Fifteenth Finance Commission for million plus cities.
- How NCAP has done. The Ministry has told Parliament that 103 of the 130 cities had lower PM10 levels in 2024-25 than in 2017-18. Independent reviews, such as those of the Centre for Research on Energy and Clean Air (CREA), have found that about two thirds of NCAP spending went on controlling road dust, while most cities that improved still exceeded the standard.
- The Graded Response Action Plan (GRAP) for Delhi and the National Capital Region was notified in January 2017 after a Supreme Court order and is now run by the Commission for Air Quality Management (CAQM), created by the CAQM Act, 2021. It has four stages tied to the AQI, switched on by forecast before the threshold is crossed, and each stage adds to the curbs of the one before.
- Vehicles. India moved straight from Bharat Stage IV to Bharat Stage VI emission norms across the country on 1 April 2020, skipping Stage V, after the Supreme Court barred the sale of Stage IV vehicles from that date. Bharat Stage VI fuel has 10 parts per million of sulphur against 50 in Stage IV, and since April 2023 vehicles must meet the norms in real driving conditions.
- Indoor air. The Pradhan Mantri Ujjwala Yojana, launched in May 2016, gives free liquefied petroleum gas (LPG) connections to poor households, and in September 2025 the Centre approved 25 lakh more connections, taking the total to about 10.6 crore. The National Family Health Survey (NFHS-5, 2019-21) found that only 58.6 per cent of households used clean cooking fuel, because many beneficiaries cannot afford regular refills.
Issues and way forward
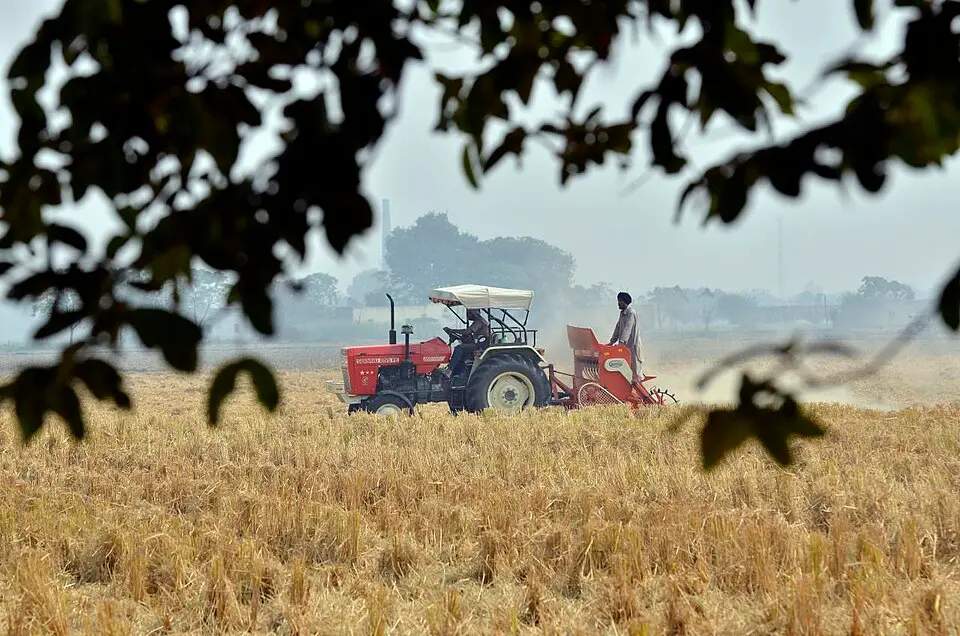
- Stubble burning. Paddy is harvested in Punjab and Haryana in October and November, leaving only about two to three weeks before wheat must be sown, and combine harvesters leave tall stubble that is cheapest to burn. The window is short partly because State laws of 2009 on saving groundwater forbid transplanting paddy before a notified date in June. Subsidised machines that sow wheat into the stubble, the Pusa decomposer developed by the Indian Agricultural Research Institute, buying straw for biomass pellets and power plants, and environmental compensation of Rs 5,000 to Rs 30,000 per incident by farm size (doubled in November 2024) are the tools; shifting area from paddy is the lasting answer.
- Cities, not airsheds. City action plans cannot fix pollution that drifts in from outside, so planning by airshed, as the CAQM does for Delhi, should extend to the whole Indo Gangetic Plain.
- Wrong targets. NCAP measures PM10, which rewards sprinkling roads, while health damage comes mainly from PM2.5 and its combustion sources; targets should move to PM2.5 and to sources such as household fuel, waste burning and industry.
- Weak data and enforcement. Many NCAP cities still have no continuous monitoring station, and State boards rarely penalise industry; denser monitoring, low cost sensors and penalties linked to emissions are needed.
- Emergency over prevention. GRAP halts construction and trucks at real economic cost for days at a time, while the sources that cause the emergency return the next season.

Common confusions
- NAAQS and AQI. The standards set the safe limit for 12 pollutants over a day or a year, while the index reports how bad today's air is for eight pollutants on a scale of 0 to 500.
- NCAP and GRAP. NCAP is a national, long term programme for 130 cities, while GRAP is a set of emergency curbs for Delhi and the National Capital Region that switch on as the AQI rises.
- Good ozone and bad ozone. Ozone in the stratosphere absorbs ultraviolet radiation and protects life, while ozone at ground level is a secondary pollutant that harms lungs and crops.
- PM10 and PM2.5. PM2.5 is a part of PM10; coarse dust dominates PM10, while combustion and secondary particles dominate PM2.5.
- Bharat Stage and Euro norms. Bharat Stage VI is India's emission standard, broadly modelled on Euro 6, and the number refers to the stage of the norms, not to a fuel grade alone.
For the exam
- Keyword bank: PM2.5, secondary aerosols, temperature inversion, mixing height, Indo Gangetic Plain airshed, NAAQS, Air Quality Index, non attainment cities, National Clean Air Programme, Graded Response Action Plan, Commission for Air Quality Management, stubble burning, Bharat Stage VI, household air pollution, source apportionment.
- Previous year questions: Practise the previous year questions on this topic →
- Use in an answer:
- Introduction with data: Air pollution was linked to 1.67 million deaths in India in 2019, about 18 per cent of all deaths, according to the India State-Level Disease Burden Initiative (Lancet Planetary Health, 2020).
- Introduction with a judgement or report: The WHO's 2021 guidelines set an annual PM2.5 limit of 5 micrograms per cubic metre, one eighth of India's national standard of 40, and most Indian cities fail even the national one.
- Conclusion: India's air will improve only when policy moves from cities to airsheds, from PM10 to PM2.5, and from emergency curbs to cutting emissions at the source.
- Conclusion: Clean cooking fuel, cleaner farming practices and stricter limits on industry and vehicles deliver health, climate and economic gains together, which makes clean air one of the most rewarding public investments.