Water pollution and river rejuvenation
- Syllabus
- Environmental pollution and degradation
- As of
- October 2026
- dissolved oxygen
- biochemical oxygen demand
- chemical oxygen demand
- self purification
- oxygen sag
- eutrophication
- point and non point sources
- designated best use
- polluted river stretches
- geogenic contamination
- arsenic
- fluoride
- uranium
- Namami Gange
- sewage treatment gap
The first principle
A river cleans itself. Bacteria in the water break down organic waste and use up dissolved oxygen as they do, while oxygen from the air dissolves back into the flowing water and replaces it. A river is polluted when the waste it receives is greater than this capacity to clean itself, which depends on how much water is flowing and how fast oxygen returns. That is why the same city's sewage that a monsoon river can absorb kills a river in the dry season, and why every river plan is at heart a plan to cut the load of untreated sewage. Groundwater, by contrast, moves slowly and has almost no capacity to clean itself, so a contaminant that enters it stays for decades.
The core
Sources
- Point and non point sources. A point source discharges at one identifiable place, such as a city drain or a factory outfall, and can be treated at that point. A non point source, such as fertiliser washing off fields or rain carrying street dirt, is spread over a whole catchment and is much harder to control.
- Sewage is the largest load by volume. It carries organic matter, nutrients and faecal bacteria. Industrial effluent from tanneries, distilleries, pulp and paper, textile dyeing and chemical units is smaller in volume but can carry heavy metals and toxic organic compounds.
How water quality is measured
- Dissolved oxygen (DO) is the oxygen fish and other aquatic life breathe. Clean water at 20 °C holds about 9 milligrams a litre at saturation, and many fish begin to suffer below about 4.
- Biochemical oxygen demand (BOD) is the oxygen that microbes consume while breaking down the organic matter in a sample, usually measured over five days at 20 °C. A high BOD means plenty of decomposable waste and therefore a falling DO.
- Chemical oxygen demand (COD) is the oxygen needed to oxidise everything oxidisable in the sample using a strong chemical oxidant, potassium dichromate, so it includes matter that microbes cannot break down and is always higher than BOD. A low ratio of BOD to COD points to industrial waste that resists biological treatment.
- Coliform bacteria, counted as the most probable number per 100 millilitres, indicate faecal contamination and the risk of diseases such as cholera, typhoid and hepatitis.
The oxygen sag
- Below a sewage outfall the BOD load makes DO fall, first in a zone of degradation and then to its lowest point in a zone of active decomposition, where fish die and anaerobic bacteria produce foul smelling gases. Downstream, as the waste is consumed and air dissolves back in, DO recovers, until the water is clean again. This curve explains why a river can be dead below a city and healthy fifty kilometres on.
Contaminants in groundwater
- Arsenic is mostly geogenic, released from the sediments themselves. In the young alluvium of the Ganga and Brahmaputra plains, arsenic held on iron oxide coatings dissolves when the aquifer turns oxygen poor, and long exposure causes arsenicosis, skin lesions and cancers. The Bureau of Indian Standards (BIS) drinking water standard, IS 10500, sets a limit of 0.01 milligrams a litre.
- Fluoride comes from minerals in granite and gneiss and is most concentrated in alkaline, calcium poor water in Rajasthan, Telangana, Andhra Pradesh, Karnataka and Gujarat. Above 1.5 milligrams a litre, the permissible limit in IS 10500, it causes dental and then skeletal fluorosis.
- Uranium, also largely geogenic, is found above the World Health Organization's guideline of 30 micrograms a litre in parts of Punjab and Haryana; its main danger is chemical damage to the kidneys rather than radiation.
- Nitrate, from fertiliser and leaking sewage, causes methaemoglobinaemia, or blue baby syndrome, in infants above 45 milligrams a litre.
Dimensions
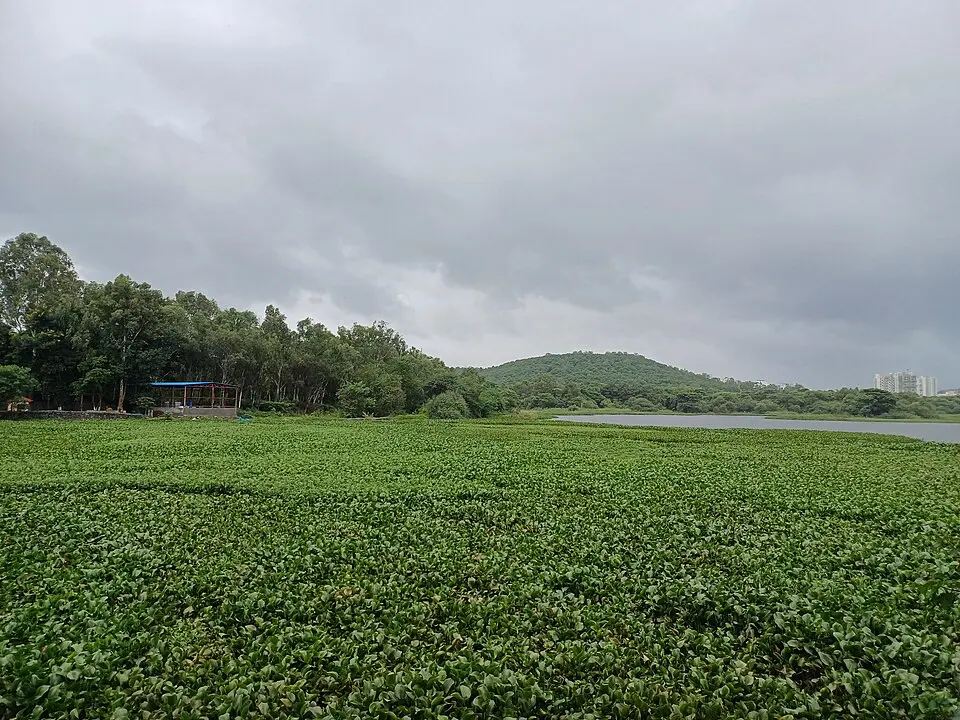
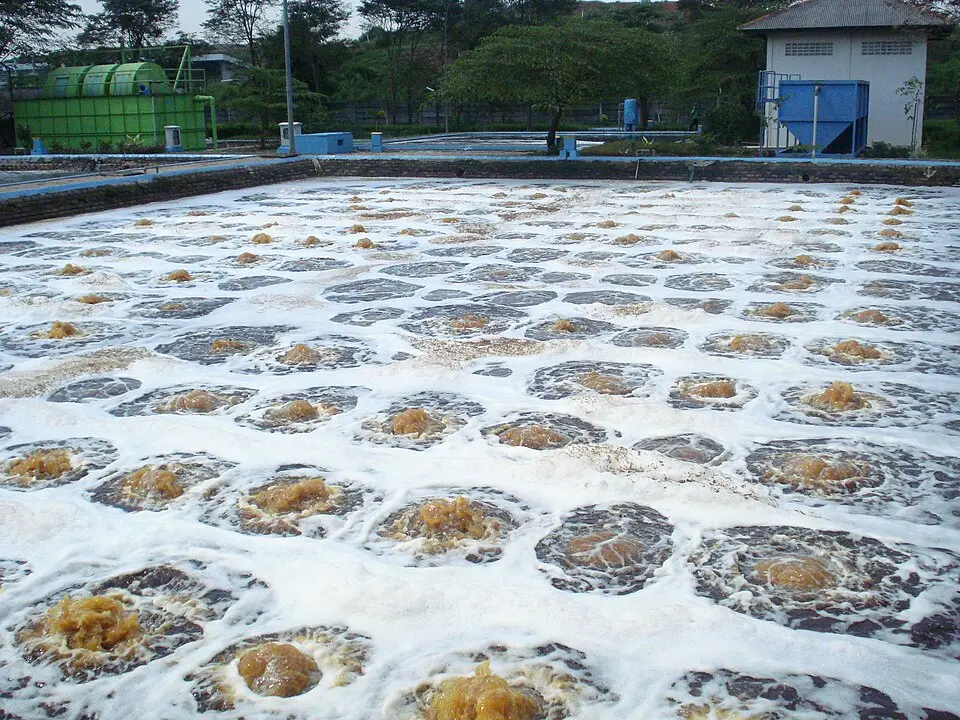
- Ecological. Nutrients from sewage and fertiliser drive eutrophication: algae bloom, die and decompose, and the decomposition strips oxygen from the water, so fish kills follow. The froth seen on the Yamuna in Delhi is the visible form of untreated sewage and detergents being churned at a barrage, and mats of water hyacinth on urban lakes feed on the same nutrients.
- Health. Faecal contamination of water remains a major cause of diarrhoeal disease, and geogenic arsenic and fluoride affect millions of people who drink untreated groundwater.
- Economic. Polluted water raises the cost of treatment for cities, damages fisheries and makes irrigation water unsafe for vegetables.
- Equity. The urban poor along drains and rural families depending on hand pumps bear most of the exposure.
- Food chain. Persistent pollutants such as methylmercury and the pesticide dichlorodiphenyltrichloroethane (DDT) accumulate in organisms (bioaccumulation) and increase up the food chain (biomagnification), as the mercury poisoning at Minamata in Japan showed.
- Cultural. The Ganga and the Yamuna are sacred rivers, which gives river cleaning a political weight that few environmental programmes enjoy.

In practice
- The law. The Water (Prevention and Control of Pollution) Act, 1974, the first pollution law, created the pollution control boards and requires consent for any discharge. The Water (Prevention and Control of Pollution) Amendment Act, 2024 replaced imprisonment for many violations with penalties of Rs 10,000 to Rs 15 lakh; it applied first to Himachal Pradesh, Rajasthan and the Union Territories, and other States may adopt it.
- Designated best use. The Central Pollution Control Board (CPCB) grades surface water in five classes, A to E, by the best use it can serve, from drinking after disinfection alone down to irrigation and industrial cooling. Class B, outdoor bathing, needs DO of at least 5 milligrams a litre and BOD of at most 3.
- Polluted river stretches. The CPCB lists a stretch as polluted when monitoring stations show BOD above 3 milligrams a litre. Its 2025 report, based on 2022 and 2023 data, counted 296 polluted stretches on 271 rivers, down from 351 in 2018, with Maharashtra having the most (54) and 37 stretches in the worst class, Priority I, where BOD exceeds 30 milligrams a litre.
- The sewage gap. The CPCB's 2021 inventory estimated urban sewage generation at about 72,368 million litres a day (MLD), against installed treatment capacity of about 31,841 MLD, of which only about 20,236 MLD was actually used, so roughly 28 per cent of urban sewage was treated.
- Namami Gange. Launched in 2014-15 with Rs 20,000 crore and continued in a second phase up to March 2026 with Rs 22,500 crore, it is run by the National Mission for Clean Ganga (NMCG) under the National Ganga Council, chaired by the Prime Minister and set up in 2016. By January 2025, 492 projects worth about Rs 40,121 crore had been sanctioned and 307 completed; sewerage projects for about 6,255 MLD had been sanctioned and 3,446 MLD of treatment capacity was operational (Press Information Bureau, March 2025). Minimum environmental flows for the upper Ganga were notified in October 2018, and new treatment plants are built under a hybrid annuity model in which the operator receives most of its payment over 15 years, linked to how well the plant performs.
- Groundwater quality. The Central Ground Water Board's (CGWB) annual quality reports, each based on about 15,000 samples, have found about a fifth of samples above the nitrate limit and close to a tenth above the fluoride limit; groundwater quantity and depletion are covered in the water resources note.

Issues and way forward
- Plants without pipes. Treatment plants run below capacity because drains and household sewer connections are not completed, so capacity and treated sewage are different numbers; funding should follow sewage actually treated, as the hybrid annuity model does.
- Running costs. Cities often cannot pay to operate plants once a scheme ends; selling treated water to industry and power plants, as the National Framework on Safe Reuse of Treated Water (2022) proposes, gives plants an income.
- Industry. Grossly polluting units still bypass treatment at night or in the monsoon; continuous online monitoring linked to the boards and common effluent treatment plants for clusters of small units, such as the tannery plant at Jajmau in Kanpur, are the answer.
- Non point pollution and lost flows. Fertiliser runoff and dams that cut dry season flow reduce a river's ability to clean itself; balanced fertiliser use, buffer strips and enforced environmental flows matter as much as treatment plants.
- Groundwater. Geogenic contamination cannot be removed at source, so safe surface water supply, community treatment units and testing by trained village women with field kits under the Jal Jeevan Mission are the practical remedies.
- Smaller towns. Most towns have no sewer network at all, so faecal sludge treatment and decentralised plants are cheaper than city scale sewers.
Common confusions
- BOD and COD. BOD measures oxygen used by microbes over five days, while COD measures oxygen needed to oxidise everything chemically, so COD is always the higher figure.
- DO and BOD. DO is the oxygen present in the water, while BOD is the oxygen demand of the waste in it; when BOD rises, DO falls.
- Eutrophication and an algal bloom. An algal bloom is one event, while eutrophication is the longer process of nutrient enrichment that causes repeated blooms and oxygen loss.
- Bioaccumulation and biomagnification. Bioaccumulation is build up within one organism over its life, while biomagnification is the rise in concentration from one level of the food chain to the next.
- Acceptable and permissible limits. Under IS 10500 the acceptable limit is the desirable value, while the permissible limit applies only where no alternative source exists; for fluoride they are 1.0 and 1.5 milligrams a litre.
- NMCG and the National Ganga Council. The Council, chaired by the Prime Minister, sets direction, while the NMCG is the mission that implements projects.
For the exam
- Keyword bank: self purification, dissolved oxygen, biochemical oxygen demand, chemical oxygen demand, oxygen sag, point and non point sources, eutrophication, designated best use, polluted river stretches, sewage treatment gap, geogenic arsenic and fluoride, biomagnification, environmental flows, hybrid annuity model, reuse of treated water.
- Previous year questions: Practise the previous year questions on this topic →
- Use in an answer:
- Introduction with data: Indian cities generate about 72,368 million litres of sewage a day but treat only about 28 per cent of it (CPCB, 2021), which is why 296 river stretches still fail the bathing standard.
- Introduction with a report: The Central Ground Water Board's annual quality reports find that about a fifth of groundwater samples exceed the nitrate limit, showing that water pollution is as much an underground problem as a river one.
- Conclusion: Rivers recover when the load falls below their capacity to clean themselves, so the measure of success is sewage actually treated and flow actually restored, not plants built.
- Conclusion: Namami Gange has built the capacity; the next step is to connect every drain, pay for operation through reuse, and extend the same discipline to the smaller rivers and towns.