Circular economy and resource efficiency
- Syllabus
- Conservation, environmental pollution and degradation, environmental impact assessment
- As of
- October 2026
- linear economy
- circular economy
- butterfly diagram
- biological and technical cycles
- R ladder
- resource efficiency
- absolute and relative decoupling
- material footprint
- industrial symbiosis
- product as a service
- design for disassembly
- right to repair
- urban mining
- Mission LiFE
- rebound effect
The first principle
The economy is a subsystem of a finite planet: it takes in materials and energy and gives back waste and heat. Matter is conserved, so whatever we extract must end up somewhere, either in use, in a dump or in the air and water. A linear economy treats the planet as an endless mine at one end and an endless sink at the other, while a circular economy tries to keep the same atoms in useful service for as long as possible, so that growth needs less new extraction and leaves less waste behind.
The core
Linear and circular
- The linear economy follows take, make, use and throw, and it is cheap for the firm only because the costs of extraction and disposal fall on others.
- The circular economy, in the framing of the Ellen MacArthur Foundation, rests on three principles: design out waste and pollution, keep products and materials in use at their highest value, and regenerate natural systems.
- The butterfly diagram shows two loops. In the biological cycle, materials that can safely return to the soil, such as food, wood and cotton, are cascaded through uses and then composted or digested to rebuild soil. In the technical cycle, materials that cannot, such as metals, plastics and electronics, are kept circulating by sharing, maintenance, reuse, refurbishing, remanufacturing and, last of all, recycling.
- The inner loops are worth more. Repairing a phone keeps the design, labour and energy embodied in it, while shredding it for metal keeps only the raw material.
The R ladder
- Ten rungs, ordered by value kept. The Netherlands Environmental Assessment Agency (PBL) set out the R ladder in 2017: refuse, rethink and reduce at the top, then reuse, repair, refurbish, remanufacture and repurpose, and finally recycle and recover (energy recovery by burning) at the bottom.
- Recycling is the lowest circular rung, because it needs energy, often loses quality with each round and depends on clean, separated waste.
Resource efficiency and decoupling
- Resource efficiency means producing the same goods and services with less material, energy, water and land, and it is measured as resource productivity, gross domestic product (GDP) per tonne of material used.
- Decoupling means breaking the link between growth and resource use. In relative decoupling resource use rises more slowly than GDP, while in absolute decoupling resource use falls even as GDP rises, and only absolute decoupling reduces pressure on the planet.
- Material footprint counts all raw material extracted anywhere in the world to meet a country's final demand, so it includes material embodied in imports. It is an indicator under Sustainable Development Goals (SDG) 8 and 12.
Business and design tools
- Product as a service sells the use of a thing rather than the thing, such as lighting sold per hour or tyres per kilometre, so the maker keeps ownership and gains a reason to build products that last.
- Design for disassembly uses screws instead of glue, standard parts and fewer mixed materials, so a product can be repaired, upgraded and finally separated into clean streams.
- The right to repair asks makers to provide spare parts, manuals and tools to owners and independent repairers.
Dimensions
- Environmental. The International Resource Panel (IRP) of the United Nations Environment Programme (UNEP) found in its Global Resources Outlook 2024 that extracting and processing materials cause over 55 per cent of greenhouse gas emissions and about 40 per cent of the health impacts of particulate pollution, while farming and forestry products cause about 90 per cent of land related biodiversity loss and water stress.
- Economic. India imports much of its oil, coal for steel, fertiliser minerals and critical minerals, so every tonne kept in use reduces import bills and exposure to price shocks; the Ellen MacArthur Foundation estimated in 2016 that a circular path could give India annual benefits of about 624 billion US dollars by 2050.
- Employment. Repair, sorting and remanufacturing are labour intensive, and the International Labour Organization (ILO) estimated in 2018 that a circular shift could create about six million jobs worldwide.
- Equity. High income countries use about six times more material per person than low income countries and cause about ten times more climate impacts per person (IRP, 2024), so the rich must cut first while the poor build basic infrastructure.
- Strategic. Recovering lithium, cobalt and rare earths from used batteries is supply security; the economics of critical minerals is in the energy sector note.
In practice
India's policy
- Draft National Resource Efficiency Policy 2019. Released by the Ministry of Environment, Forest and Climate Change (MoEFCC) in July 2019 for comments, it proposed a National Resource Efficiency Authority to set targets and track progress. It noted that India's material consumption rose from about 1.18 billion tonnes in 1970 to about 7 billion tonnes in 2015, and that India recycles only 20 to 25 per cent of its waste against about 70 per cent in Europe. It remains a draft.
- Eleven sector committees. In 2021 the Government formed eleven committees, led by line ministries and coordinated with the National Institution for Transforming India (NITI Aayog), to prepare circular economy action plans for municipal solid and liquid waste, scrap metal, electronic waste, lithium ion batteries, solar panels, gypsum, toxic and hazardous industrial waste, used oil, agricultural waste, tyres and rubber, and end of life vehicles.
- Extended producer responsibility (EPR) is the main legal tool. Several of these streams are now governed by EPR rules under the Environment (Protection) Act 1986, which cover plastic packaging, electronic waste, batteries, tyres, used oil and end of life vehicles, often with a minimum share of recycled content in new products. The detailed rules are in the notes on solid and hazardous waste and on plastic pollution.
- Mission Lifestyle for Environment (LiFE), launched in October 2022, takes the circular idea to the household through actions such as reducing waste, refusing single use plastic and cutting electronic waste.
- The Right to Repair portal, launched by the Department of Consumer Affairs on National Consumer Day, 24 December 2022, gathers manuals, repair videos and information on spare parts and warranties for four sectors: farming equipment, mobile phones and electronics, consumer durables and automobiles.
- Vehicle scrappage policy. The Voluntary Vehicle Fleet Modernisation Programme, launched in August 2021, sends old vehicles to registered scrapping facilities after fitness tests at automated stations (after 15 years for commercial and 20 for private vehicles), and a scrapping certificate earns a road tax rebate and a registration fee waiver on a new vehicle. The Steel Scrap Recycling Policy 2019 complements it.
- Urban mining and critical minerals. Recovering metals from electronic waste and batteries is urban mining, and in September 2025 the Cabinet approved a scheme of Rs 1,500 crore over six years to build capacity for recycling critical minerals from such scrap.
- International. Under India's Group of Twenty (G20) presidency, the Resource Efficiency Circular Economy Industry Coalition (RECEIC) was launched in Chennai in July 2023 by 39 companies from 11 countries, built on partnerships, technology cooperation and finance.
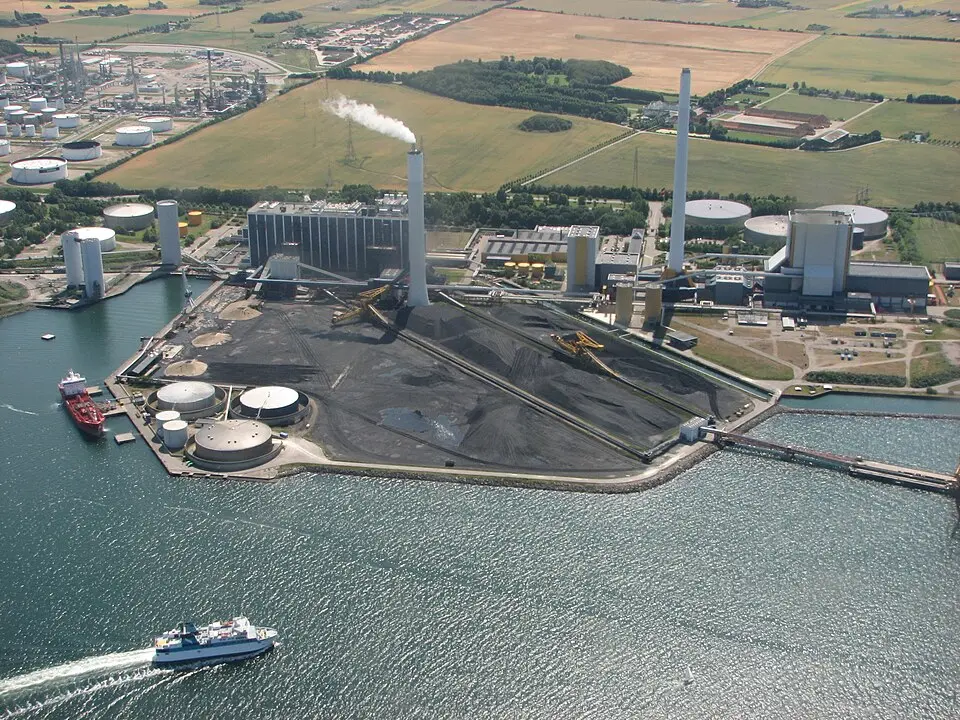
Industrial symbiosis: Kalundborg
- One firm's waste is another's input. At Kalundborg in Denmark, firms began exchanging by products in 1972: surplus steam and heat from the power station served a refinery, a pharmaceutical plant and the town's district heating, and gypsum from flue gas cleaning went to a plasterboard maker.
- The gains are measurable. The partnership reports annual savings of about 635,000 tonnes of carbon dioxide, 3.6 million cubic metres of water and 87,000 tonnes of materials, and its lesson is that symbiosis grows from nearness and trust rather than a master plan; the use of fly ash in cement and of slag in roads in India applies the same idea.

Issues and way forward
- The rebound effect. When efficiency makes a good cheaper, people use more of it, as William Stanley Jevons observed of coal in 1865, so efficiency gains need caps, prices or standards that hold total use down.
- Recycling without the higher rungs. Indian policy leans on EPR certificates for recycling while repair and design rules are weak; durability and repairability standards, of the kind the European Union (EU) adopted in 2024, would move effort up the ladder.
- No overarching target. With the resource efficiency policy still a draft, India has no national target for material productivity, so finalising it with an authority to track material flows is the next step.
- Physical limits. Every loop loses some material and needs energy, and a growing economy needs more stock than old products can supply, so circularity can slow extraction but not end it.
- Informal workers. Waste pickers and kabadiwalas do most collection while EPR money flows to registered recyclers, so linking them to the EPR chain is a matter of both justice and supply.
- Cheap virgin material. Where mining and landfills are underpriced, recycled material cannot compete, so landfill charges and recycled content mandates are needed.
Common confusions
- Circular economy and recycling. Recycling is only the outermost loop; a circular economy puts refusing, reducing, repairing and reusing ahead of it.
- Relative and absolute decoupling. Relative decoupling means resource use grows more slowly than GDP, while absolute decoupling means resource use falls as GDP grows.
- Material footprint and domestic material consumption. The footprint counts all raw material used anywhere to make what a country consumes, while domestic material consumption is domestic extraction plus the weight of imports minus exports, which ignores the raw material used abroad to make those imports and so flatters countries that import finished goods.
- Refurbishing and remanufacturing. Refurbishing restores a product to working order, while remanufacturing rebuilds it to the standard of a new one, often with a new warranty.
For the exam
- Keyword bank: linear economy, circular economy, butterfly diagram, biological and technical cycles, R ladder, resource productivity, absolute decoupling, material footprint, industrial symbiosis, product as a service, design for disassembly, right to repair, urban mining, extended producer responsibility, rebound effect.
- Previous year questions: Practise the previous year questions on this topic →
- Use in an answer:
- Introduction with data: The world now extracts about 106 billion tonnes of material a year, more than three times the 1970 level, yet under 7 per cent of what it uses comes from recycled sources (IRP, 2024; Circularity Gap Report, 2025).
- Introduction with a policy: The Draft National Resource Efficiency Policy 2019 noted that India's material consumption rose sixfold between 1970 and 2015 while it recycled only a fifth to a quarter of its waste.
- Conclusion: A circular economy is less about better recycling than about products that are built to last, be repaired and be taken back, so design rules and the right to repair matter as much as EPR targets.
- Conclusion: For a country that imports much of its energy and critical minerals, keeping materials in use is an environmental duty and an economic strategy at the same time.